Live
Automated Hospital Data Monitoring System
An automated data pipeline that checks the Australian Institute of Health and Welfare (AIHW) for new public hospital data every week and feeds it into a Power BI dashboard comparing Queensland hospitals with their peers.
Last run
16 Nov 2026, 3:02 am
Data checks
23/23 passed
New data
No new AIHW release
Next run
Mon, 23 Nov, 3:00 am AEST
- Data pipeline
- Pythondbtcron
- Database
- PostgreSQLSQL
- Deployment
- Linux Virtual Private Server (VPS)Docker
- Dashboard
- Power BIDAX
01Why I built it
Getting value out of business data takes two kinds of skill. One is knowing what the numbers mean and whether they can be trusted. The other is the technical work of getting data out of systems, shaping it and keeping it flowing. My audit background at EY and my Master of Data Science gave me a grounding in both, and I wanted a project where I could practise both and show them working together.
The technical side is the newer one for me, so that’s where I pushed hardest. Instead of a notebook on my laptop, I deployed a live ELT pipeline on a virtual private server, so it runs on schedule without depending on me or my hardware. The pipeline:
- Logs every run.
- Tests its own output each time.
- Is watched by a monitoring service outside the server that emails me if a run fails or never starts.
Real pipelines lean on outside services that go down now and then; in my case, the AIHW API timed out on my first full load. I wanted to know when that happens, not find out weeks later.
I chose hospital data because the AIHW publishes it openly, it matters to the people who use those hospitals, and it’s messy enough to be interesting: suppressed values, caution flags and peer-group quirks.
02How it works
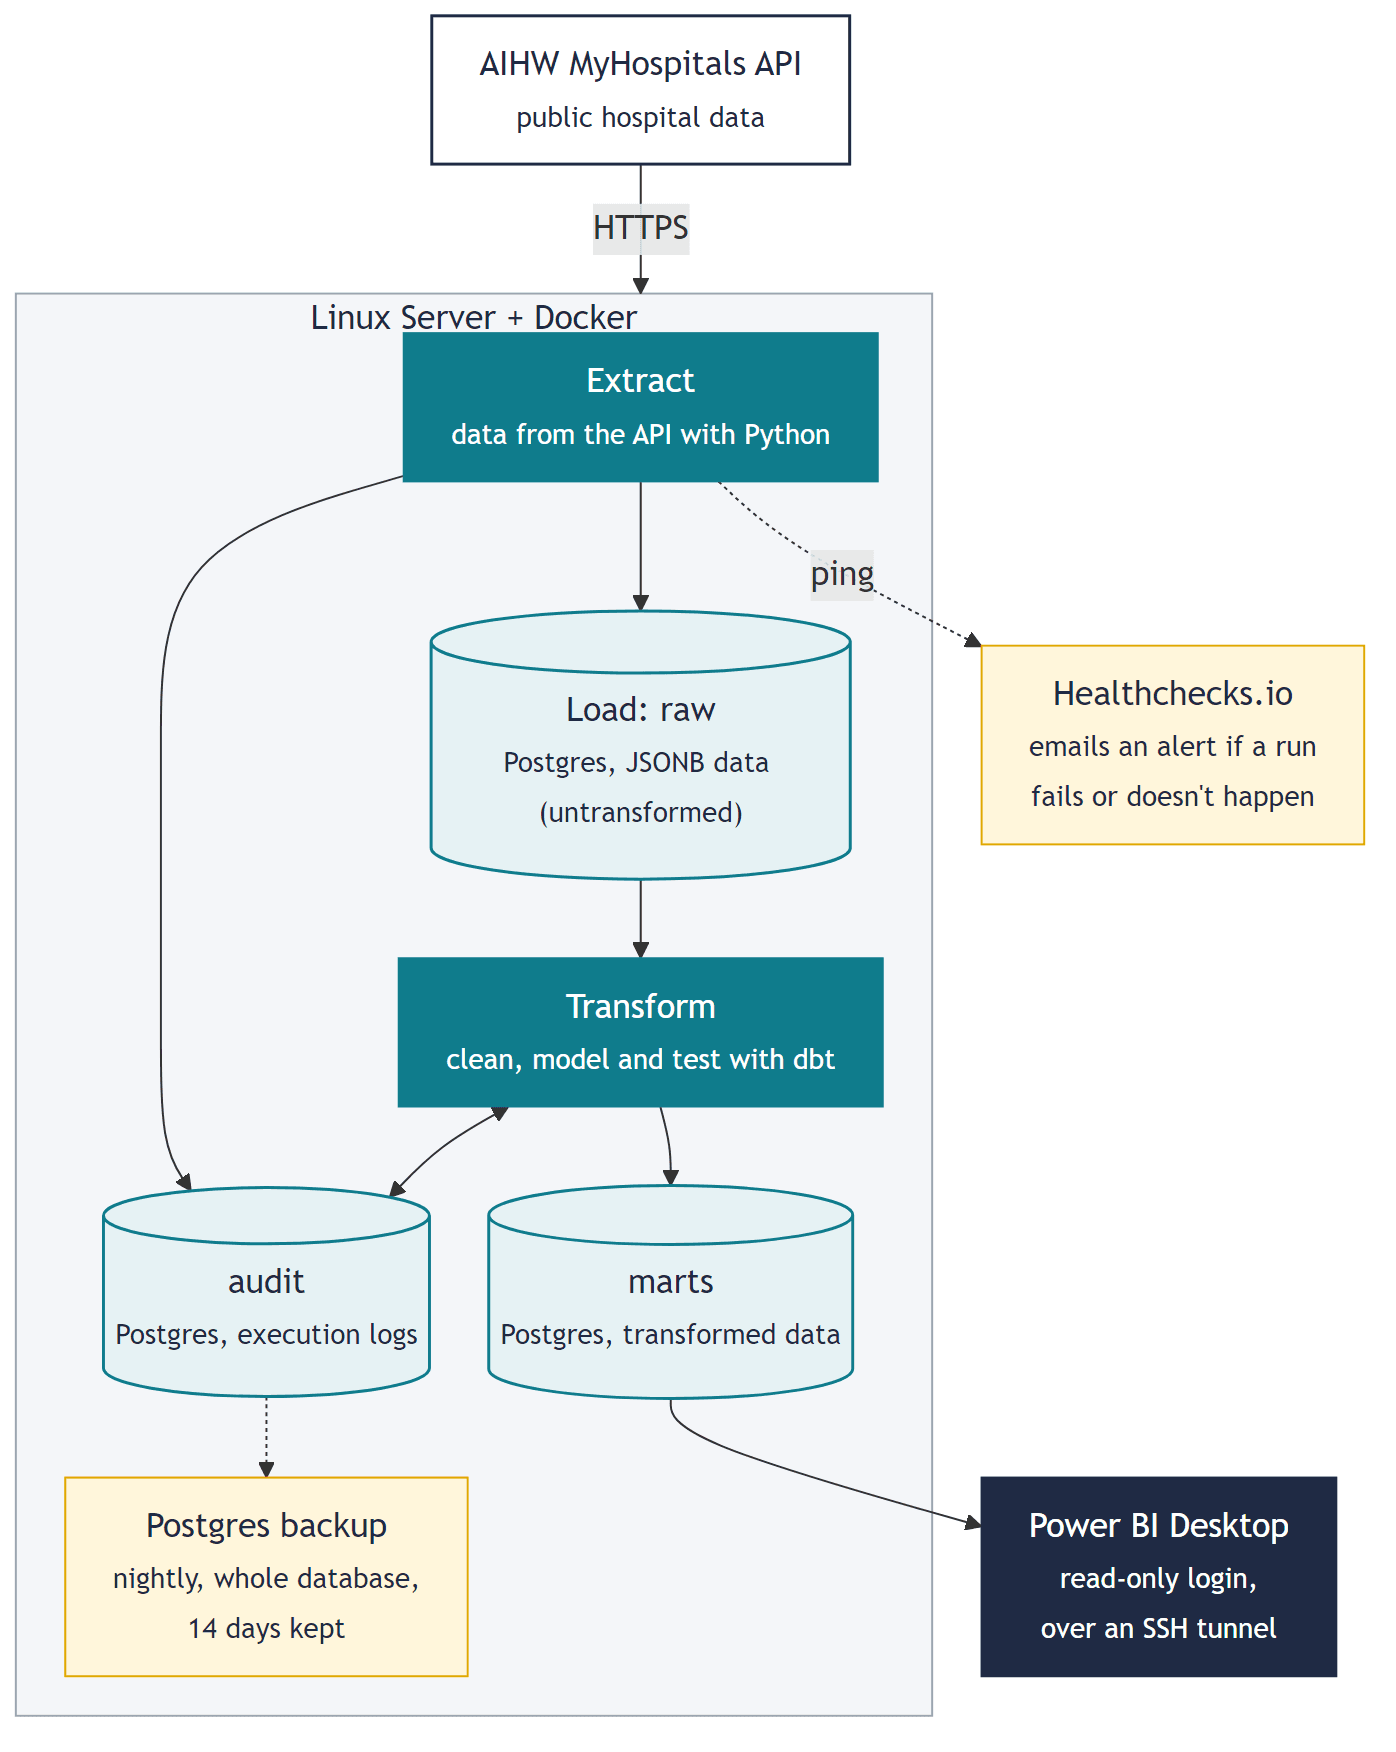
Everything except Power BI and the Healthchecks.io monitor runs in Docker on a Linux virtual private server (VPS). Here’s the path the data takes, and why each step is built the way it is.
- 1
Fetch only what’s new
Every week a cron job starts the pipeline.
- It first asks the AIHW MyHospitals API which data version it’s publishing and skips the download if that version is already in the database, so a quiet week loads zero rows and re-running is always safe.
- When there is new data, it downloads one measure at a time, because paging through the biggest category (693,110 rows) in one go hit gateway timeouts deep in the dataset.
- Failed requests are retried after 5, 15, 30, then 60 seconds.
- 2
Keep the raw data untouched
Records are stored exactly as the API sent them, as JSON in PostgreSQL, and bulk-loaded with COPY.
- Each category loads in a single transaction together with its audit record: all of it lands, or none of it does.
- The audit record notes the category, the AIHW data version and upload date, the number of rows loaded, the run it belongs to and when it landed.
- Because the original stays untouched, a misread field is fixed with a code change and a rebuild rather than a re-download.
- The reconciliation has a true copy of what the API sent to check against.
- 3
Model it for analysis
dbt (data build tool) turns the raw JSON into clean tables using SQL, in two layers:
- Staging: parses and types every field.
- Star schema: one fact table of 862,030 results linked to hospital and measure dimensions.
Power BI is built for this shape. Filters flow from the small dimension tables into the big fact table, which keeps the DAX simple and the visuals fast.
- 4
Test every build
23 dbt tests run with every pipeline execution, weekly or manual, to check the data’s completeness, integrity and validity:
- Keys present and unique.
- Every result linked to a known hospital and measure.
- Percentages between 0 and 100.
- Suppressed values left blank.
- A three-way reconciliation of row counts, explained below.
If any test fails, the build fails, the run is marked failed and I get an email.
The check that matters most
Most tests ask “does this value look right?”. Reconciliation asks the question an analyst or a health executive asks first: “is everything here?”. It counts rows at three points, from the API, in raw storage and in the final model, and fails the build if they don’t match.
-- Fails the build if any row was lost or invented select api_rows.n, raw_rows.n, fact_rows.n, dup_rows.n from api_rows, raw_rows, fact_rows, dup_rows where api_rows.n <> raw_rows.n or raw_rows.n <> fact_rows.n + dup_rows.n -- Latest run: 862,030 = 862,030 = 862,030 + 0 - 5
Log everything, alert on failure
Every run, load and test result is written to an audit schema, including failed runs and how far they got. That matters most on the bad days: the first version recorded 0 rows for a failed run that had actually loaded three categories, so I fixed it.
- After each run the script pings Healthchecks.io, a monitoring service outside the server, which emails me if a run fails or doesn’t check in on time.
- The whole database is also backed up nightly, with 14 days kept.
- 6
Serve the dashboard securely
The database isn’t reachable from the internet, because an open database port gets scanned within hours.
- It only listens on the server itself, and the firewall allows SSH and nothing else.
- Power BI Desktop connects through an SSH tunnel with a read-only login that can see the finished tables but not the raw data.
- Power BI imports a snapshot into the report.
03The dashboard
Four example pages built on the star schema, showing how far Power BI can be shaped around a question: DAX measures, dynamic titles, conditional formatting, drill-through, synced slicers and a custom theme. Click any screenshot to enlarge it, or download the .pbix file to explore the data snapshot yourself.
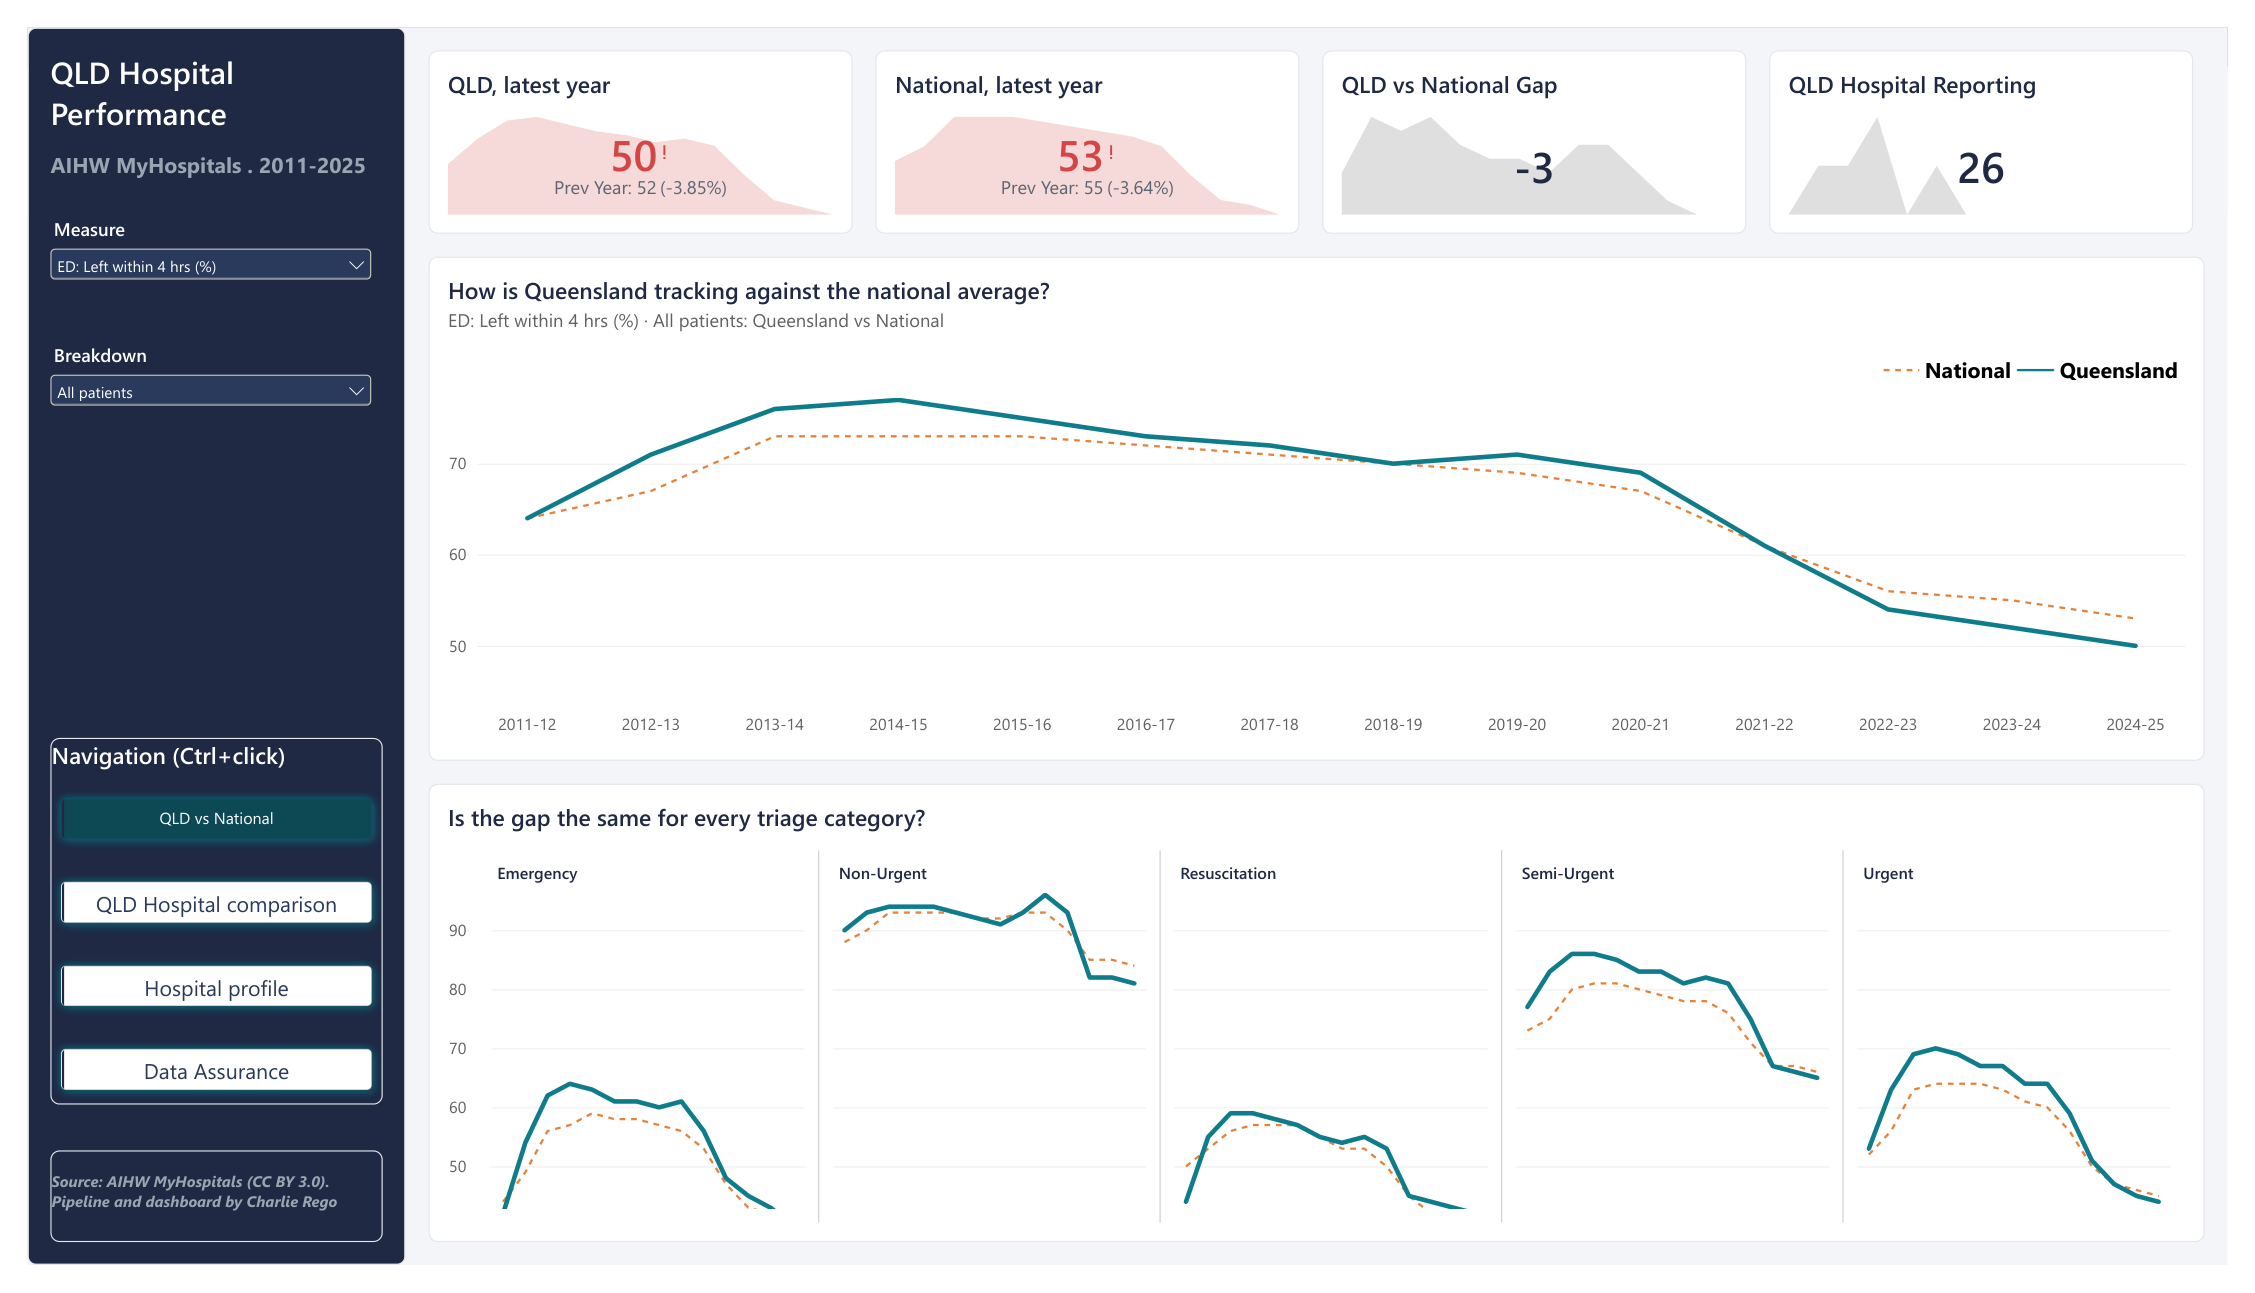
Headline numbers and the long-run trend for any measure, with small multiples by triage category.
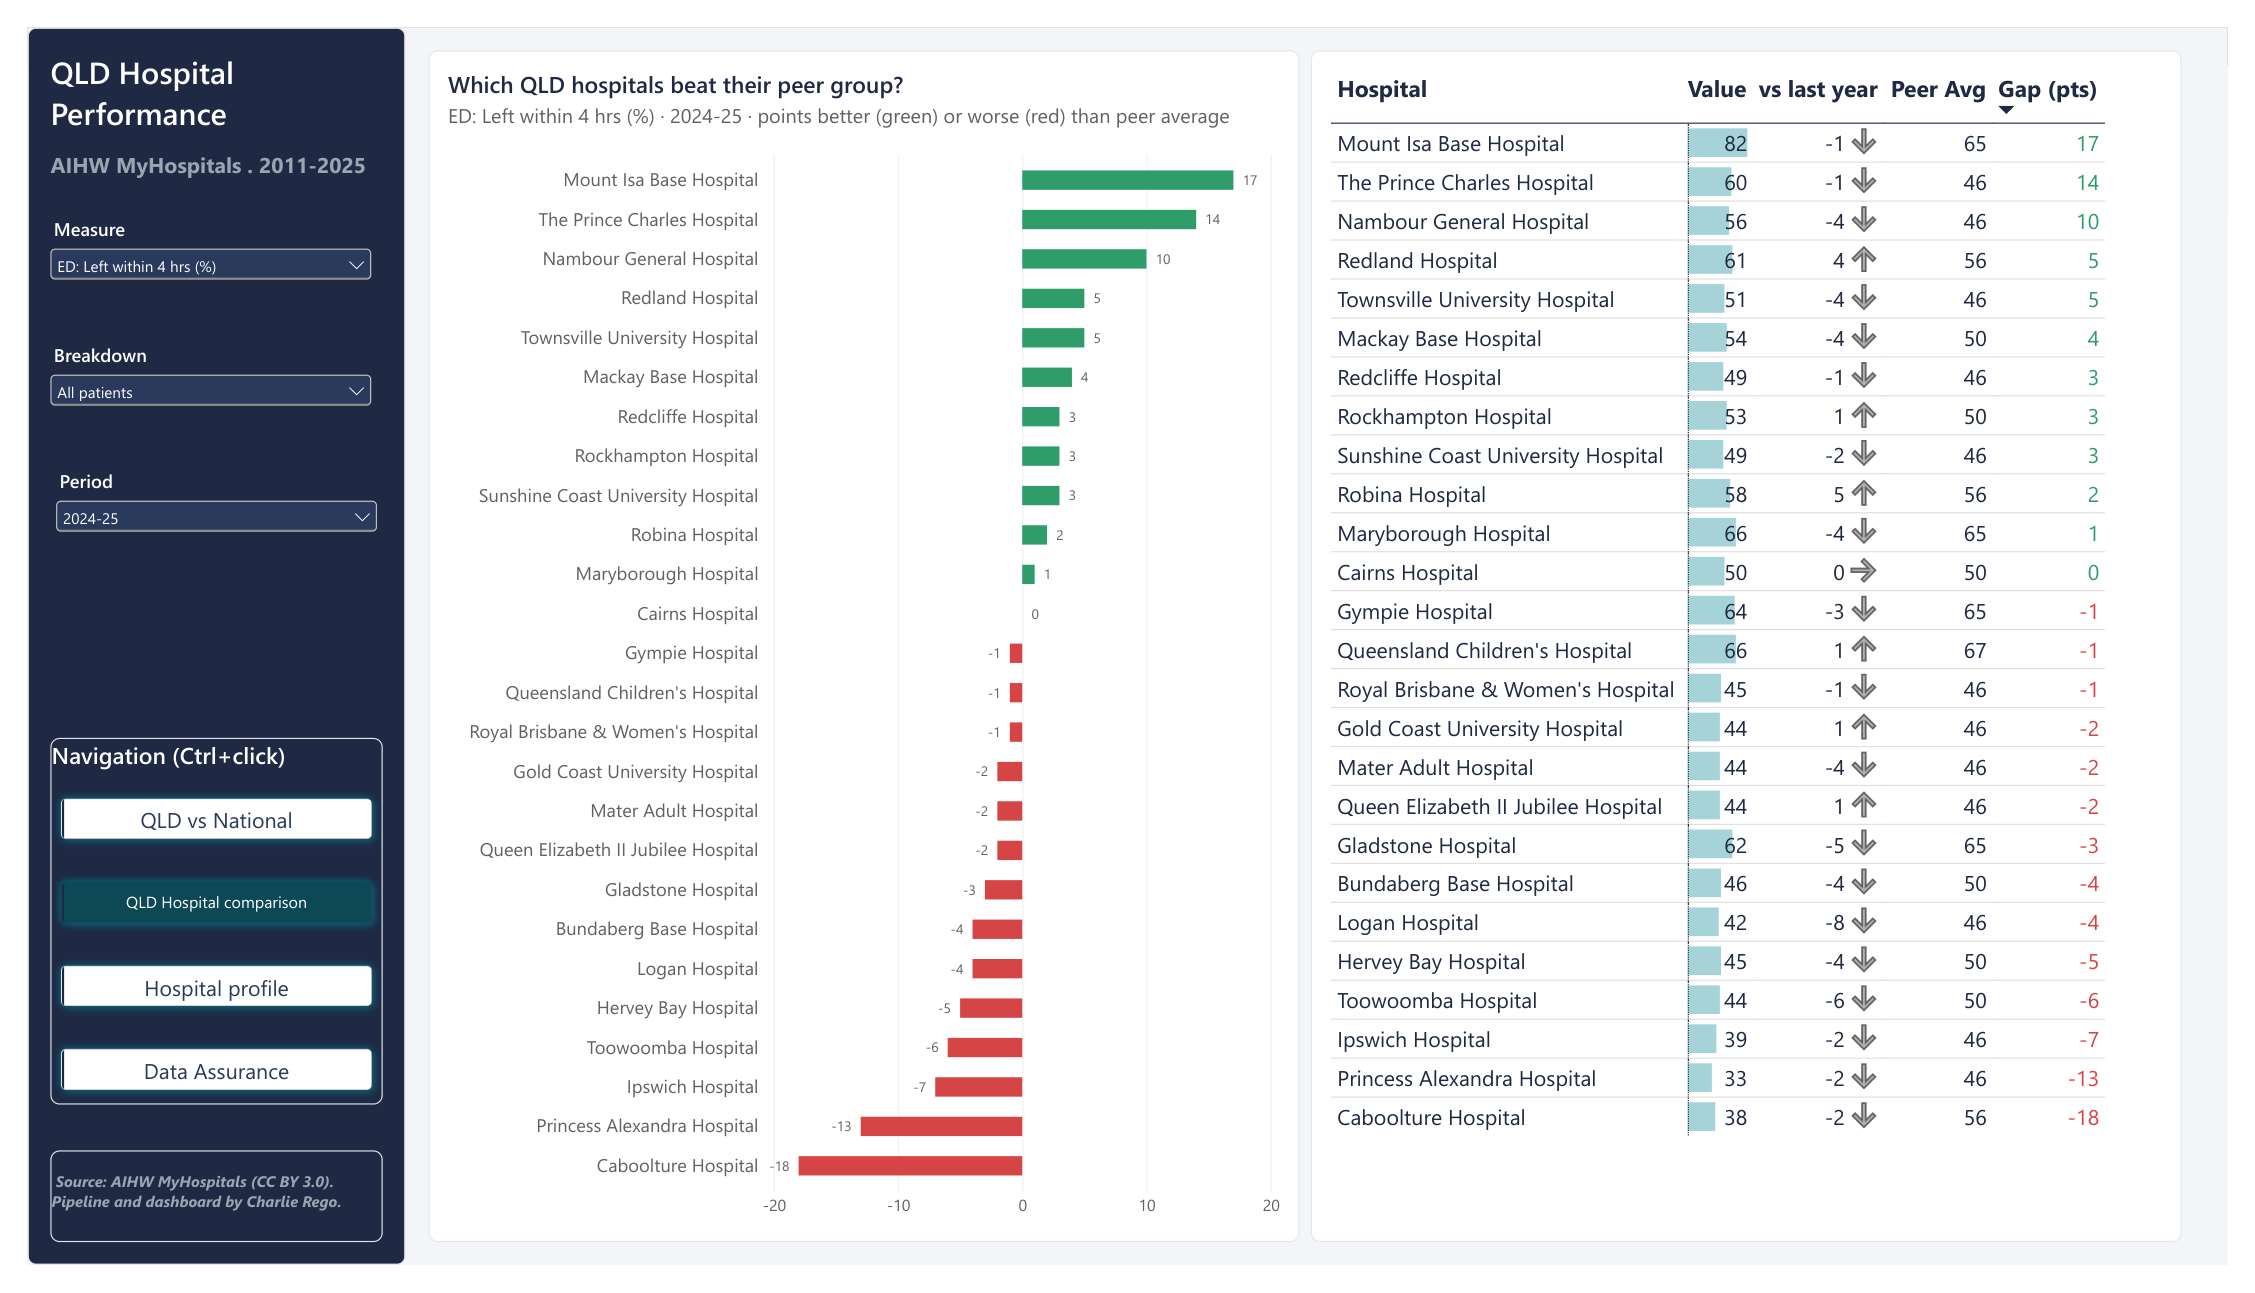
Every Queensland hospital against its peer-group average. Green beats peers, red falls short. Right-click a bar to drill into that hospital.
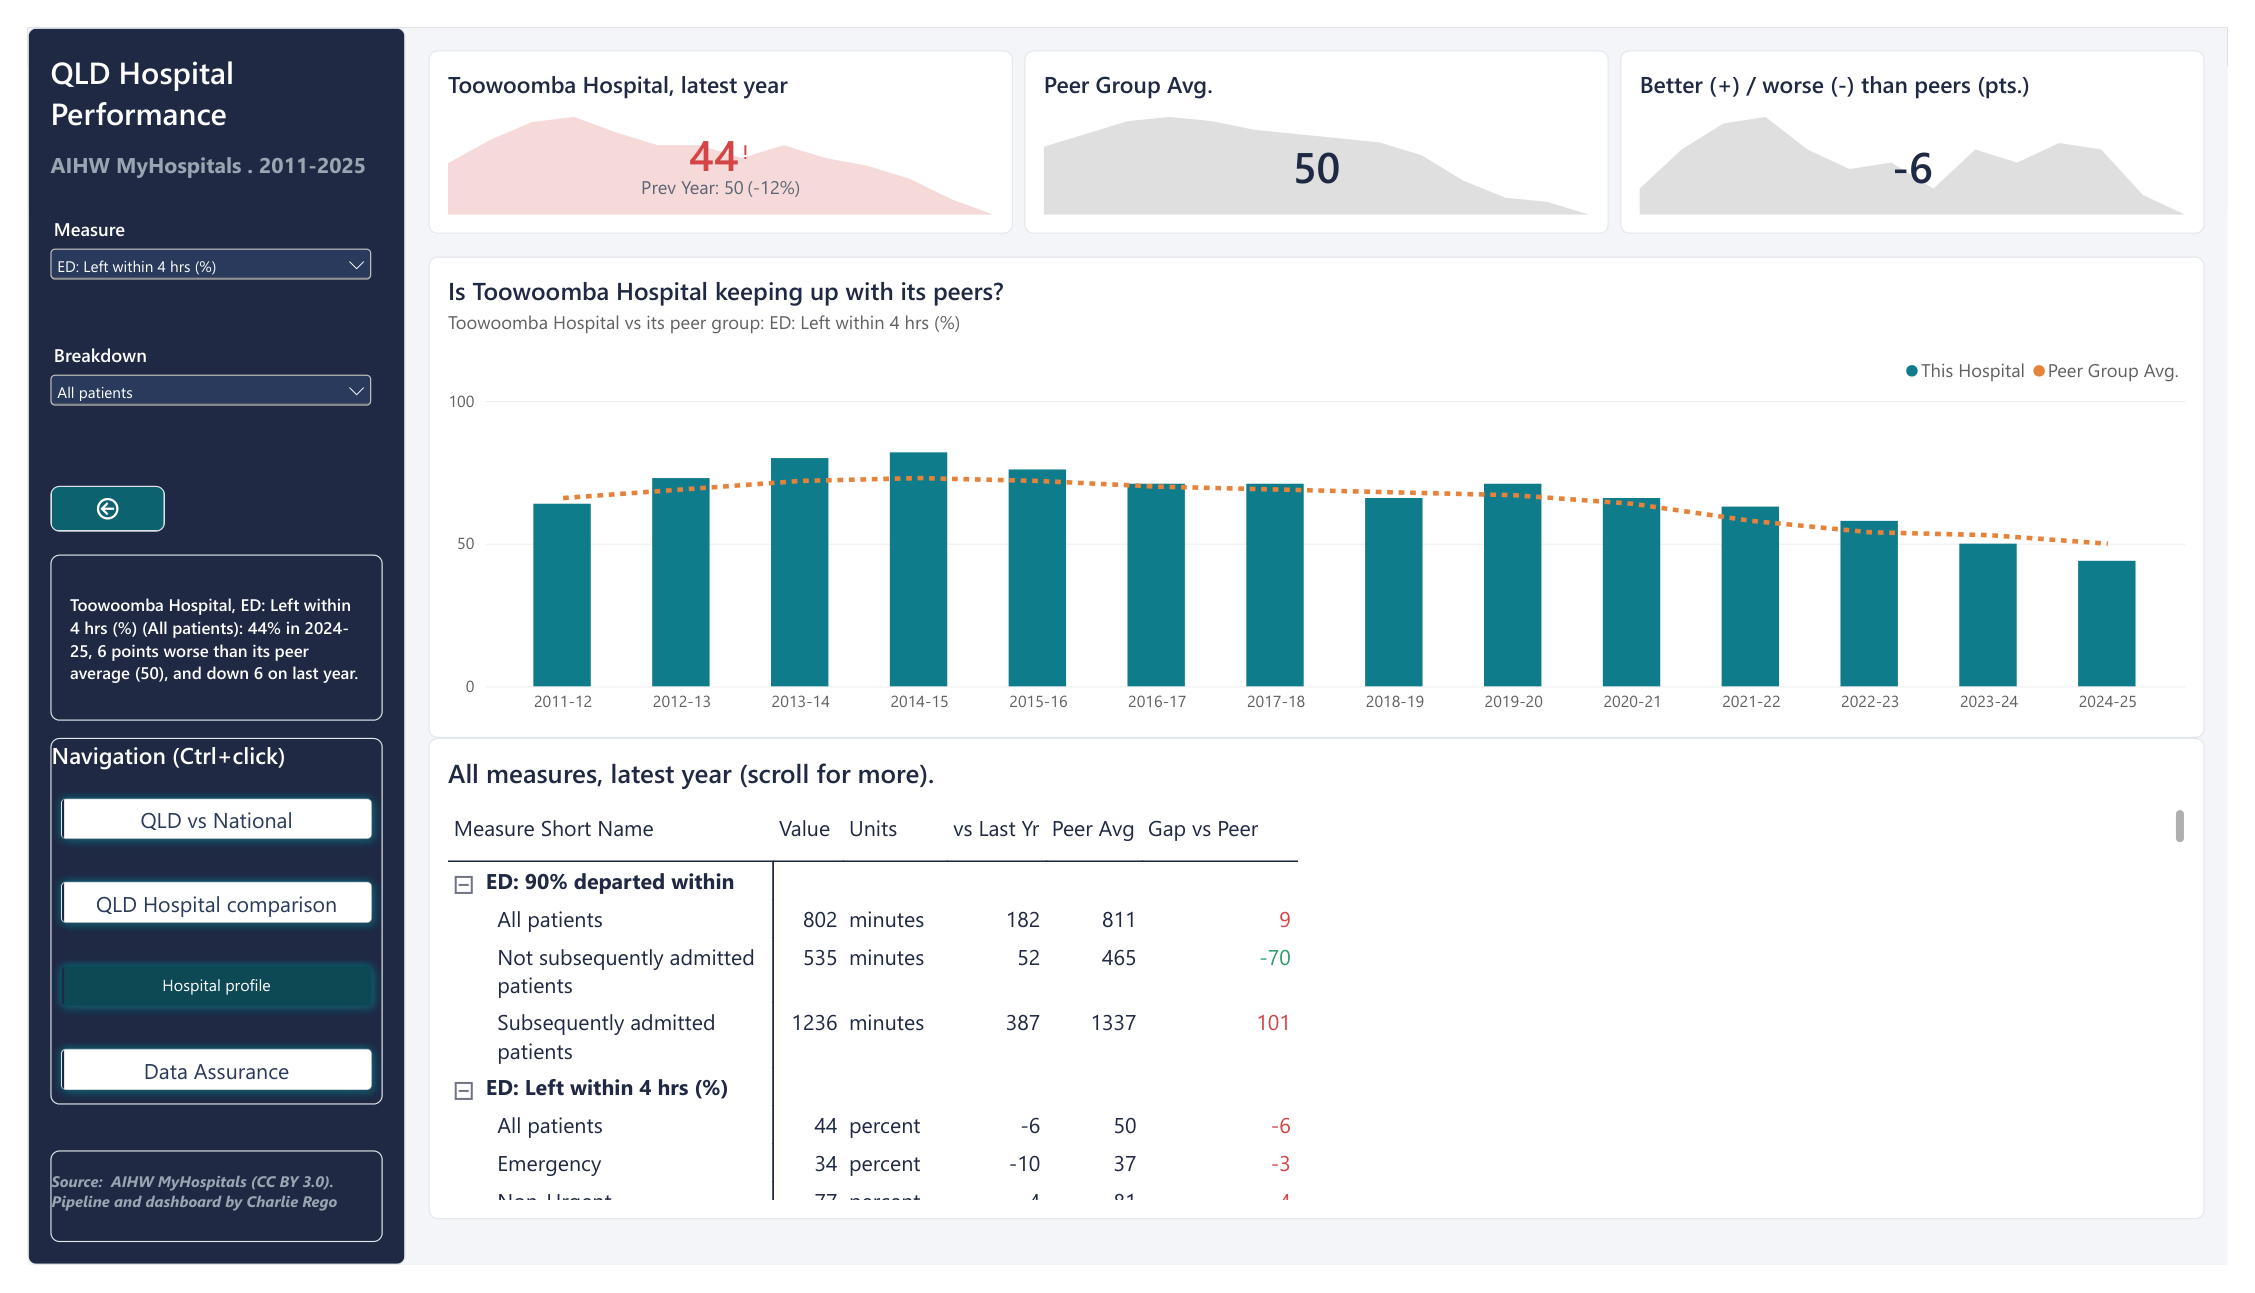
A drill-through page, opening on Toowoomba: the trend against peers, plus every measure for the latest year.
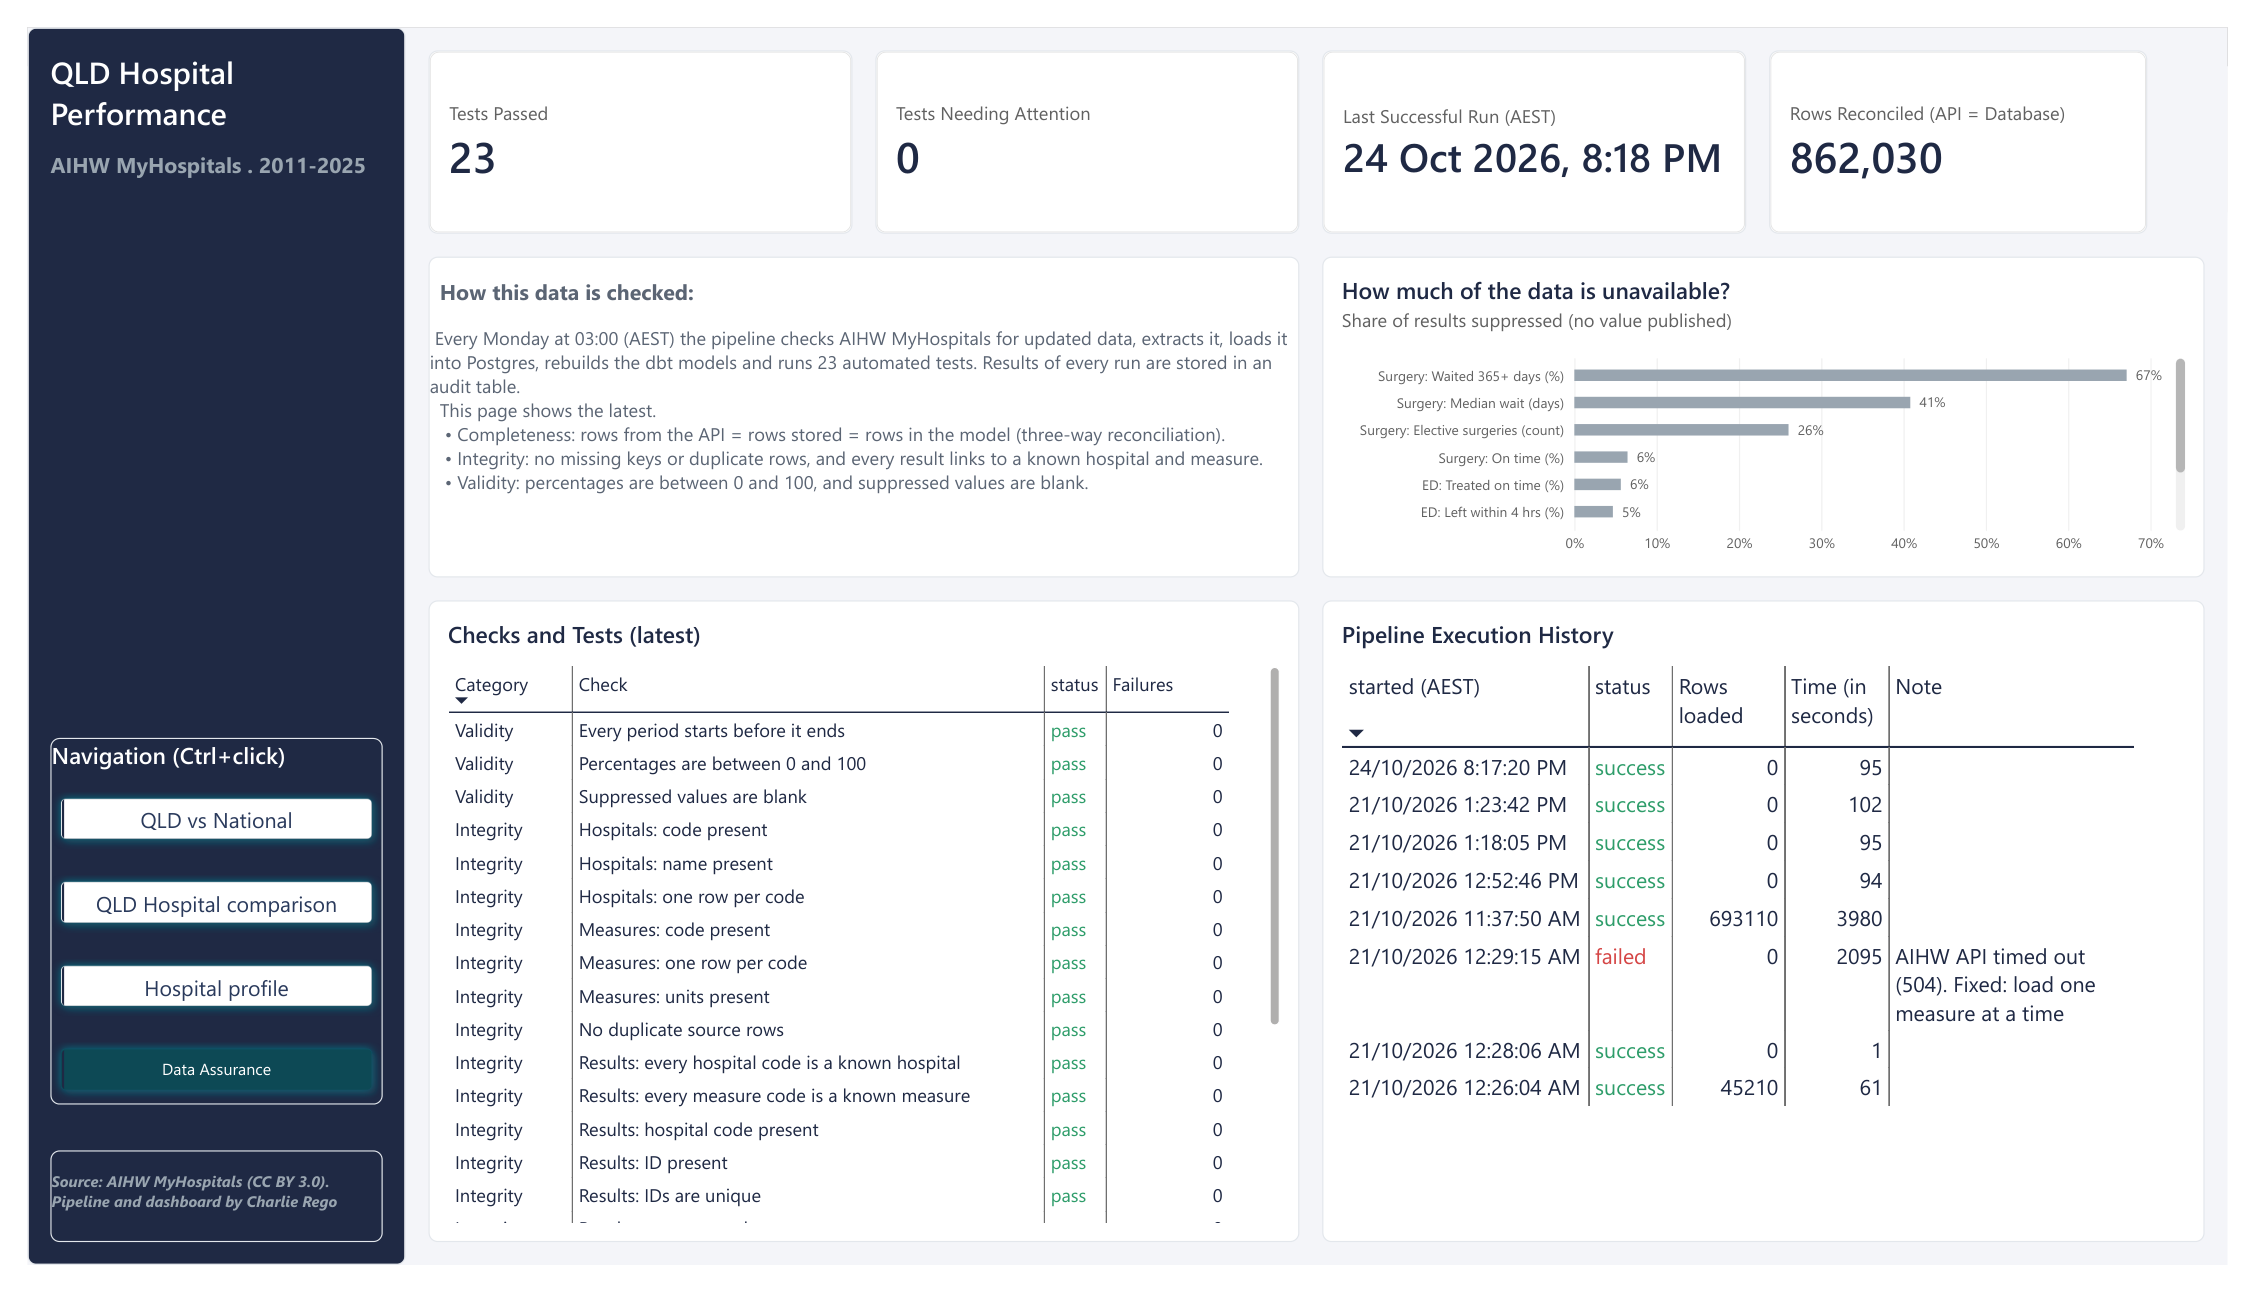
The pipeline’s own health: test results, the reconciled row count and run history, including a real API timeout and its fix.
04What the data says
A few things stood out. These figures describe what changed, not why: demand, patient acuity, staffing and bed access all sit behind them. All figures are from the AIHW’s published 2024-25 data unless stated.
Across Queensland
In 2024-25, 11 of 26 Queensland hospitals beat their peer group on the share of ED patients who left within 4 hours, 14 fell short and one matched. The spread runs from 17 points above peers (Mount Isa) to 18 below (Caboolture), and 19 of the 26 slipped compared with the year before.
Toowoomba Hospital
- ED: time in the department
- 44% of patients left ED within 4 hours in 2024-25, down from 66% in 2020-21 and 6 points below similar large regional hospitals (50%). Median time in ED rose from 189 to 272 minutes, against 241 for Queensland and 228 nationally.
- ED: the longest waits
- At the long end Toowoomba still edges its peers: nine in ten patients had left ED within 802 minutes, against 811 for peers. That lead was 104 minutes in 2020-21, so it has narrowed.
- Elective surgery
- 98% of urgent elective surgery patients were treated within the recommended 30 days in 2024-25, ahead of peer hospitals (91%).
Full write-up with caveats and data notes: findings.md.
05Keeping it trustworthy
Three-way reconciliation
Rows from the API = rows stored = rows in the model (plus any quarantined duplicates). Proves nothing was lost or invented between source and dashboard.
Quarantine, don’t delete
Duplicate source rows are flagged, counted and kept out of the facts, never silently dropped. This load had none, but the check runs every week.
Honest failure records
A run that fails halfway still records what it loaded. The dashboard shows the real timeout from the first full load, and the fix.
Least privilege
Database bound to the server only, firewall open to SSH alone, and a read-only reporting login that can’t see raw data. No secrets in the repo, and the full git history was checked before going public.
06What I learned, and what’s next
Tests catch misunderstandings, not just bad data.
A warning flagged 879 “suppressed” rows that had values. The AIHW’s code list showed “*” means “interpret with caution”, not “hidden”. The data was fine; my parsing was wrong.
Design for failure first.
The first full load died at row 290,000 with gateway timeouts, and the audit log claimed 0 rows. Both are fixed and written up in the decision log.
DAX makes wrong numbers look right.
Blank minus a number isn’t blank, and CALCULATE filters stack with the visual’s own filters. Both gave plausible but wrong results until I checked them against SQL.
Write down why.
Every non-obvious choice has an entry in the decision log with its trade-off, so the next person (or me in six months) doesn’t have to guess.
The build diary and every design decision are in the repo: devlog · decision log.
Coming soon
Predictive model: expected vs actual ED performance
Given a hospital’s size and patient mix, what share of its emergency patients should leave within the 4-hour target, and is it doing better or worse than that? Comparing each hospital with its own expected result is fairer than a raw league table. The model will be scored on hospitals it has never seen, and will have to beat simple averages to count.
Want the detail?
Code, tests and docs are on GitHub.
Data is sourced from AIHW MyHospitals, CC BY 3.0 AU.